
How many times have you heard end users say something along the line of “I just want to run a simple report with all my departments!” Heck, you may have even said it yourself. Analysts are generally simple creatures, they want their reports fast, legible, and accurate. And if you’re using Hyperion on-premise, Planning Budgeting Cloud (PBCS), Enterprise Budgeting Cloud (EPBCS), or even Essbase, we as administrators need to provide those reports, either through Financial Reporting Studio, Financial Reporting Web Studio or Management Reports in Enterprise Performance Reporting Cloud (EPRCS).
So let’s say you have Financial Reporting Web Studio with PBCS as your data source and your analysts are not familiar with Smart View (yes there are a few organizations that have no clue what Smart View is!). Here are a few tips and tricks that you can employ to ease the frustration when it comes to running reports:
- Prompts
When designing a report, we can limit the type of data to assign to a dimension, making the report more dynamic. This gives our analysts more freedom to get the data they need, instead of forcing them to use reports that may or may not suit their needs. Additionally, they don’t have to go fishing through a long list of members to find the one member they need, which leads to frustration and yadda, yadda, yadda, you get the picture.
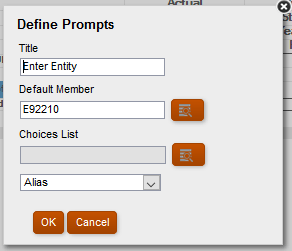
For example, you could create a department budget report that enables the user to select from a specific list of departments. All you would do is select “Prompt for Entity” in the Member Selector and in the Define Prompts dialog box, select specific departments, any defaults departments, and whether you want to display the member name, alias, or member name and alias.

- User Point of View
Like prompts, User Point of View (POV) can also limit the members a user has access to when running a report. The idea here (as with prompts) is making the process of running reports “user-friendly. The use case here is maybe an analyst in Academic Affairs needs to run a report for all Academic Affairs departments. Instead of having to pick those departments every time, the analyst can enter their departments one time, and that selection will be retained.
To set up the user point of view:
- While in the grid, select Task in the menu bar, and then select Set Up User POV (make you have previously selected “Current point of View for [Dimension]” in the member selector).
- You should see the following dialog box:

For each dimension, define whether the user point of view will include all members in the dimension or an individual member.
- Alternate Roll-ups
I personally like this option because you can creatively create an alternate hierarchy for a specific administrator, group, division, or even one that contains particular accounts or cost centers that analysts report on regularly. For those who are not familiar with alternate hierarchies, this is where a single member can have multiple parents and contribute differently to each parent. To accomplish this, members in the alternate hierarchies are shared members, and they refer to nonshared members of the default hierarchy in the outline.
In this product example below, notice the dimension Products has a child All Merchandise, and each of the descendants are nonshared. High End Merchandise is an alternate hierarchy grouping a few members, and each of those members is shared.
Now a user can run a report specifically on high-end merch or all merchandise and doesn’t have to worry about selecting only the members they want to report on (Awesome, isn’t it?!)
There are hundreds of other things we can use to make reporting user-friendly. For example, some big ones that you should be using are:
- Suppression- helps to keep the report nice and clean by removing data that doesn’t apply.
- Saved Objects- reuse images or text boxes over and over again to ensure reports have that nice consistent look. You can also link the objects to the source, so you only have to make one change.
But when it comes to users being frustrated because they don’t want to find two departments in a list of 100 or to help them run reports quickly and accurately, the tips above should do the trick. Feel free to leave other suggestions in the comment section!
Till next time!
